| Class | 10 |
| Chapter | Statistics |
| Subject | Math |
| Category | Important Question Answer |
Class 10 Math Chapter 13 Important Question Answer
Q1. 100 surnames were randomly picked up from a local telephone directory and the frequency distribution of the number of letters in the English alphabets in the surnames was obtained as follows:
| Number of letters | 1-4 | 4-7 | 7-10 | 10-13 | 13-16 | 16-19 |
| Number of surnames | 6 | 30 | 40 | 16 | 4 | 4 |
Find the median numbers of letters in the surnames.
Ans.
| Number of letters | Number of surnames | Cumulative Frequency |
| 1-4
4-7
7-10
10-13
13-16
16-19 | 6
30
40
16
4
4 | 6
36
76
92
96
100 |
Now, n=100,  . This observation lies in the class 7-10.
Then, l (lower limit) = 7,
cf (the cumulative frequency of the class preceding 7-10) = 36
f (the frequency of the median class 7-10) = 40,
h (the class size) = 3.
Using the formula, Median = l +  × h
× h
Median =7 +  =7 + 1.05 = 9.05
Q2. The median of the following data is 28.5. Find the values of x and y, if the total frequency is 60.
| Class interval | 0-10 | 10-20 | 20-30 | 30-40 | 40-50 | 50-60 |
| Frequency | 5 | x | 20 | 15 | y | 5 |
Ans.
| Class-Interval | Frequency | Cumulative Frequency |
| 0-10
10-20
20-30
30-40
40-50
50-60
| 5
x
20
15
y
5 | 5
5 + x
25 + x
40 + x
40 + x + y
45 + x + y |
It is given that n = 60
So, 45 + x + y = 60 i.e., x + y = 15
The Median is 28.5, which lies in the class 20-30
So, l = 20, f = 20, cf = 5 + x, h = 10
Using the formula, Median = l + × h
28.5 = 20 + 
28.5 – 20 = 
17 = 25 – x
x = 8
putting vlaue of x in x + y = 15,
we get y = 7
Q3. Consider the distribution of daily wages of 50 workers of a factory :
| Daily Wages (in Rs.) | 100-120 | 120-140 | 140-160 | 160-180 | 180-200 |
| Number of workers | 12 | 14 | 8 | 6 | 10 |
Find the mean daily wages of the workers of the factory by using an appropriate method.
Ans.
As the given data is large, we will use step deviation method to find the mean.
Here a = 150, h = 20
| Class Interval | Frequency (fi) | Class Marks (ui) |  | fiui |
| 100-120 120-140 140-160 160-180 180-200 | 12 14 8 6 10 | 110 130 150 (a) 170 190 | -2 -1 0 1 2
| -24 -14 0 6 20 |
 |  |
Step Deviation Method :  = a +
= a +  × h
× h
= 150 +  = 150 –
= 145.20
Hence, the mean daily expenditure on food is Rs.145.20
Q4. The following distribution shows the daily pocket allowance of children of a locality: The mean pocket allowance is Rs. 18. Find the missing frequency f.
| Daily pocket (in Rs.) | 11-13 | 13-15 | 15-17 | 17-19 | 19-21 | 21-23 | 23-25 |
| Number of chapter | 7 | 6 | 9 | 13 | f | 5 | 4 |
Ans.
| Daily pocket allowances ( in Rs.) | Class Mark (xi) | Number of children (fi) | Di = xi – 18 | fidi |
| 11-13 13-15 15-17 17-19 19-21 21-23 23-25 | 12 14 16 18 ( let a = 18) 20 22 24 | 7 6 9 13 f 5 4 | -6 -4 -2 0 2 4 6 | -42 -24 -18 0 2f 20 24 |
| Total |  |  |
We have,
Assumed Mean Method : = a + 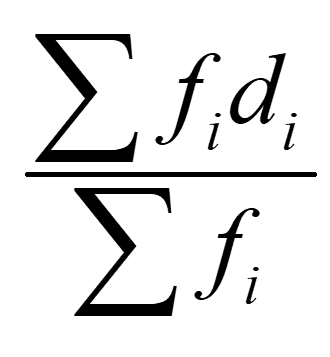
18 = 18 + 
0 =
2f – 40 = 0
f = 20
Therefore, required frequency is 20.
Q5. The following data gives the information on the life-time (in hours) of 75 electrical instruments:
| Life-time (in hours) | 0-20 | 20-40 | 40-60 | 60-80 | 80-100 | 100-120 |
| Frequency | 10 | 15 | 12 | 21 | 8 | 9 |
Determine the modal lifetime of the components.
Ans.
Here the maximum frequency is 21. So the modal class is 60-80.
Now,
Modal class = 60-80, lower limit (l) of modal class = 60, class size (h) = 20
Frequency (f1) of modal class = 21
Frequency (f0) of class preceding the modal class = 12,
Frequency (f2) of class succeeding the modal class = 8
Now, Using Mode = l + 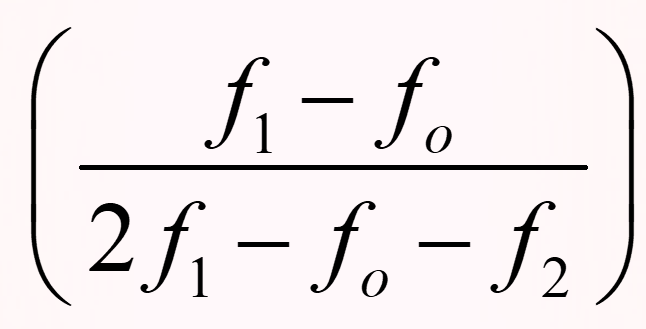 × h
× h
Mode = 60 +  = 60 +
  = 68.18
Q6. The median of the following data is 525. Find the value of x and y, if the total frequency is 100:
| Class-Interval | Frequency |
| 0-100 100-200 200-300 300-400 400-500 500-600 600-700 700-800 800-900 900-1000 | 2 5 x 12 17 20 y 9 7 4 |
Ans.
| Class-Interval | Frequency | Cumulative Frequency |
| 0-100
100-200
200-300
300-400
400-500
500-600
600-700
700-800
800-900
900-1000 | 2
5
x
12
17
20
y
9
7
4 | 2
7
7+x
19 + x
36 + x
56 + x
56 + x + y
65 + x + y
72 + x + y
76 + x + y
|
It is given that n = 100
So, 76 + x + y = 100 i.e., x + y = 24
The Median is 525, which lies in the class 500-600
So, l = 500, f = 20, cf = 36 + x, h = 100
Using the formula, Median = l + × h
525 = 500 + 
525 – 500 = (14 – x)×5
25 = 70 – 5x
5x = 70 – 25 = 45
x = 9
putting value of x in x + y = 24,
we get 9 + y = 24
y = 15
Q7. A survey regarding the heights (in cm) of 51 girls of class X of a school was conducted and the following data was :
| Obtained height (in cm) | Less than 140 | Less than 145 | Less than 150 | Less than 155 | Less than 160 | Less than 165 |
| Number of girls | 4 | 11 | 29 | 40 | 46 | 51 |
Find the median height.
Ans.
The given distribution being of the less than type. Therefore, the classes should be below 140, 140-145, 145-150, ….., 160-165.
The frequency of class interval below 140 is 4, frequency of class interval 140-145 is 11-4=7. Similarly the frequency of 145-150 is 29-11=18 and so on.
So, our frequency distribution table with the given cumulative frequencies becomes :
| Class Interval | Frequency | Cumulative Frequency (cf) |
| Below 140 | 4 | 4 |
| 140-145 | 7 | 11 |
| 145-150 | 18 | 29 |
| 150-155 | 11 | 40 |
| 155-160 | 6 | 46 |
| 160-165 | 5 | 51 |
Now, n=51,  . This observation lies in the class 145-150.
Then, l (lower limit) = 145,
cf (the cumulative frequency of the class preceding 145-150) = 11
f (the frequency of the median class 145-150) = 18,
h (the class size) = 5.
Using the formula, Median = l + × h
Median = 145 + 
= 145 +  = 149.03
Q8. The table below shows daily expenditure on food of 25 households in a locality :
| Daily Expenditure (in Rs.) | 100-150 | 150-200 | 200-250 | 250-300 | 300-350 |
| No. of households. | 4 | 5 | 12 | 2 | 2 |
Find the mean daily expenditure on food by suitable method.
Ans.
Here, a = 225 and h = 50
| Class Interval | Frequency | Class Marks | | fiui |
| 100-150 150-200 200-250 250-300 300-350 | 4 5 12 2 2 | 125 175 225 (a) 275 325 | -2 -1 0 1 2
| -8 -5 0 2 4 |
 |  |
Step Deviation Method : = a + × h
= 225 +  = 225 – 14
= 211.
Hence, the mean daily expenditure on food is Rs.211.
Q9. The following distribution shows the daily pocket money of children of a school:
| Daily Pocket Money (Rs.) | 11-13 | 13-15 | 15-17 | 17-19 | 19-21 | 21-23 | 23-25 |
| Number of Children | 7 | 6 | 9 | 13 | 20 | 5 | 4 |
Find the average daily pocket money of children.
Ans.
| Daily pocket allowances ( in Rs.) | Class Mark (xi) | Number of children (fi) | Di = xi – 18 | fidi |
| 11-13 13-15 15-17 17-19 19-21 21-23 23-25 | 12 14 16 18 ( let a = 18) 20 22 24 | 7 6 9 13 20 5 4 | -6 -4 -2 0 2 4 6 | -42 -24 -18 0 40 20 24 |
| Total |  |  |
We have,
Assumed Mean Method : = a +
= 18 +  = 18
= 18
Therefore, the average daily pocket money of children is Rs. 18.
Q10. The following distribution gives the monthly consumption of consumers of a locality. Find the median of the distribution.
| Monthly consumption (in units) | 65-85 | 85-105 | 105-125 | 125-145 | 145-165 | 165-185 |
| Number of consumers | 4 | 8 | 13 | 20 | 14 | 4 |
Ans.
| Monthly consumption (in units) | Number of consumers (f) | Cumulative Frequency (cf) |
| 65-85 | 4 | 4 |
| 85-105 | 8 | 12 |
| 105-125 | 13 | 25 |
| 125-145 | 20 | 45 |
| 145-165 | 14 | 59 |
| 165-185 | 4 | 63 |
Now, n = 63,  . This observation lies in the class 125-145 .
Then, l (lower limit) = 125,
cf (the cumulative frequency of the class preceding 125-145) = 25,
f (the frequency of the median class 125-145) = 20,
h (the class size) = 20.
Using the Formula, Median = l + × h
Median = 125 +  = 125 + 6.5 = 126.5
Q11. The wickets taken by a bowler in 10 cricket matches are as follows:
3 5 2 1 2 0 5 1 2 4
Find the mode of the data.
Ans. Arranging data in ascending order : 0, 1, 2, 2, 2, 3, 4, 5, 5
From above data we can clearly conclude that 3 is the mode of data as it is used in max times.
Therefore,
Mode = 3
| Also Read | Class 10 Math NCERT Solution |
| Also Read | Class 10 Important Questions [Latest] |